Advanced order flow for the crypto market

Cignals levels the playing field for all Bitcoin and crypto traders. Our volumetric charts show you where market-makers, institutions, and algorithms are trading.

App screenshot

Maximize your win rate.

Whales and institutional players leave specific signatures on the tape, which we analyze and share with you. Don't be left in the dark.

Get Started

Ultra-fast Depth of Market (DOM)

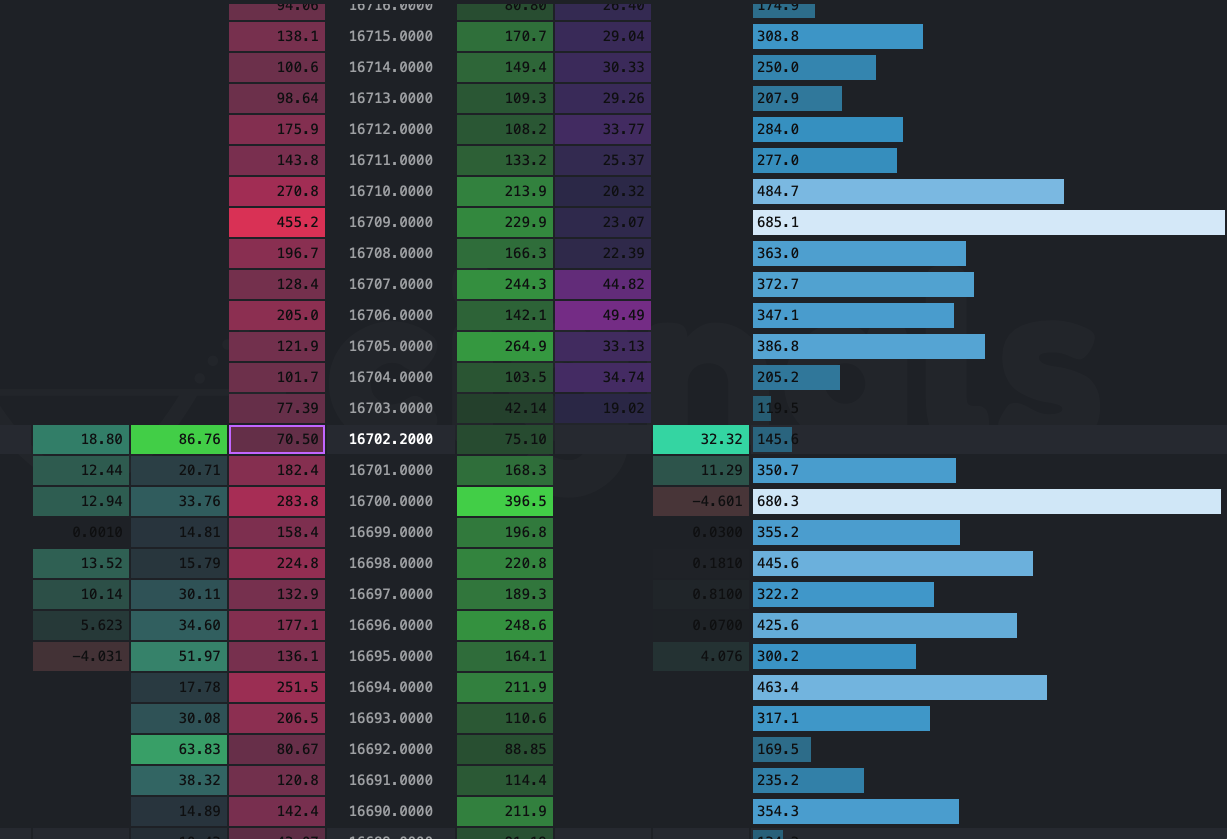
We take the time to optimize and design tools for high efficiency. Our depth of market helps provide a professional edge to help you time your trades and locate where liquidity rests on the Order Book. We include visibility into pulling & stacking, market imbalance, delta, liquidations, and momentum. Explore various aspects of the market by effortlessly toggling between modes and views.

“@cignalsio is one of my favorite data platforms for tracking crypto markets, if you're into that sort of thing”
@aviflombaum
Avi Flombaum, CPO Revature
Cignals depth-of-market (DOM) interface

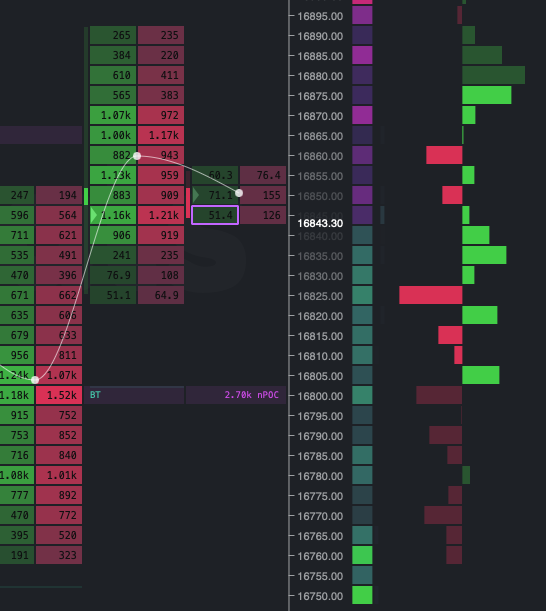
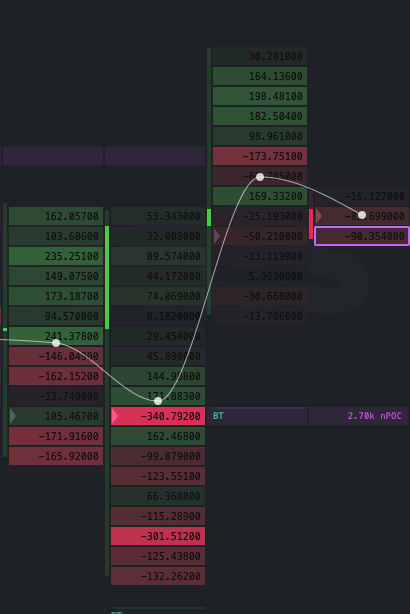
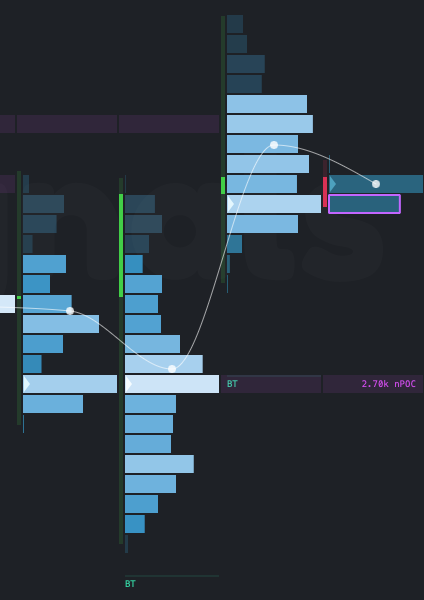
Volume Cluster / Footprint Charts

Cignals gives you a unique view of the action inside the candle. With this extra detail, you can see what market-makers are doing and trade with a superior edge, relative to other retail traders. Use three different views: delta of the trades, a buy/sell stacked split, or total volume for each price level. Deltas show you where absorption is high, stacks will give you the secrets behind imbalance, leading to additional trades to restore balance, and total volume indicates where the point of control is for each time step. Footprint charts are what professional traders use every day to make profitable trades.

Cignals volume cluster / footprint chart interface

The Best Bitcoin Order Flow Charts

Since 2016, our team of professional traders and engineers has been at the forefront of innovation in the crypto markets.

Edge Imbalance

Our novel edge imbalance indicator shows you where excess liquidity sits, allowing you to catch retail traders offsides and trade with the market makers.

Continuous Delta

Our new proprietary indicator captures the tape activity based on the σ of cumulative delta. Real-time trading activity helps time your execution perfectly with institutional traders.

Delta Clusters

Differences between buying and selling at each price level leaves signatures on the tape that reveal the intentions of whales and other large institutions.

Volume Profile Clusters

The modern replacement to MarketProfile™ used by professional proprietary traders worldwide. These clusters give you visibility into where the volume is inside each candle.

Lower Studies

Extra indicators to help you find confluence: Open Interest, Long/Short Ratio, Funding Rate, Historical Volatility, Average True Range (ATR), Chaikin Money Flow (CMF), and more…

Overlays

Starting with VWAP, overlay price scale data on top of the volumetric charts for relative comparison.

Aggregate Delta

See where the delta and volume groups intersect on the time series in order to determine at which points there are divergences to take action.

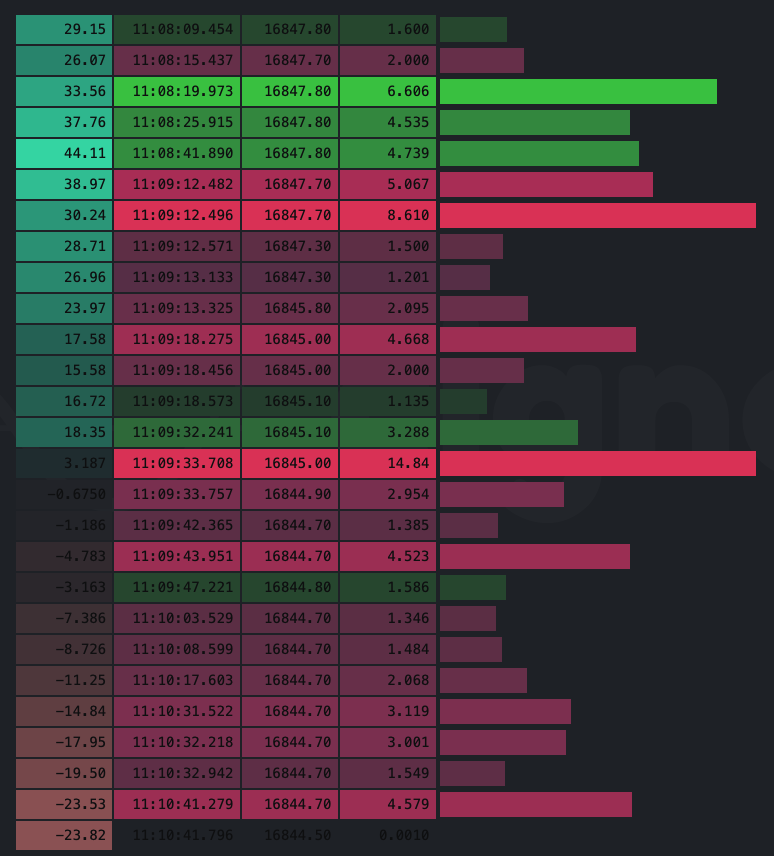
Advanced Tape & DOM

See individual trades and filter by size to detect whales as they open and close positions. Find where market participants are stacking orders or pulling them from the Order Book.
Featurette 01
Featurette 02
Featurette 03
Featurette 04
Featurette 05

We monitor the world's top crypto exchanges at the Speed of Light

Our high-availability, professional-tier tick plant streams 12,192 instruments from 18 exchanges worldwide. This data is then aggregated and displayed directly on your screen so you can have the fastest access to the action. Data streams and historical data are available through our API and data warehouse for automated trading bots, quantitative trading strategies, or research.

Binance
Coinbase
Kraken
KuCoin
Bitfinex
Bybit
MEXC
… and 11 more

Ready to dive in? Sign up now

Need some help?

Join our Discord and chat with the team or watch our YouTube videos and course material. We also have a free Substack newsletter.