Whales and institutional players leave specific signatures on the tape, which we analyze and share with you. Don't be left in the dark.
Get StartedWe take the time to optimize and design tools for high efficiency. Our depth of market helps provide a professional edge to help you time your trades and locate where liquidity rests on the Order Book. We include visibility into pulling & stacking, market imbalance, delta, liquidations, and momentum. Explore various aspects of the market by effortlessly toggling between modes and views.
“@cignalsio is one of my favorite data platforms for tracking crypto markets, if you're into that sort of thing”
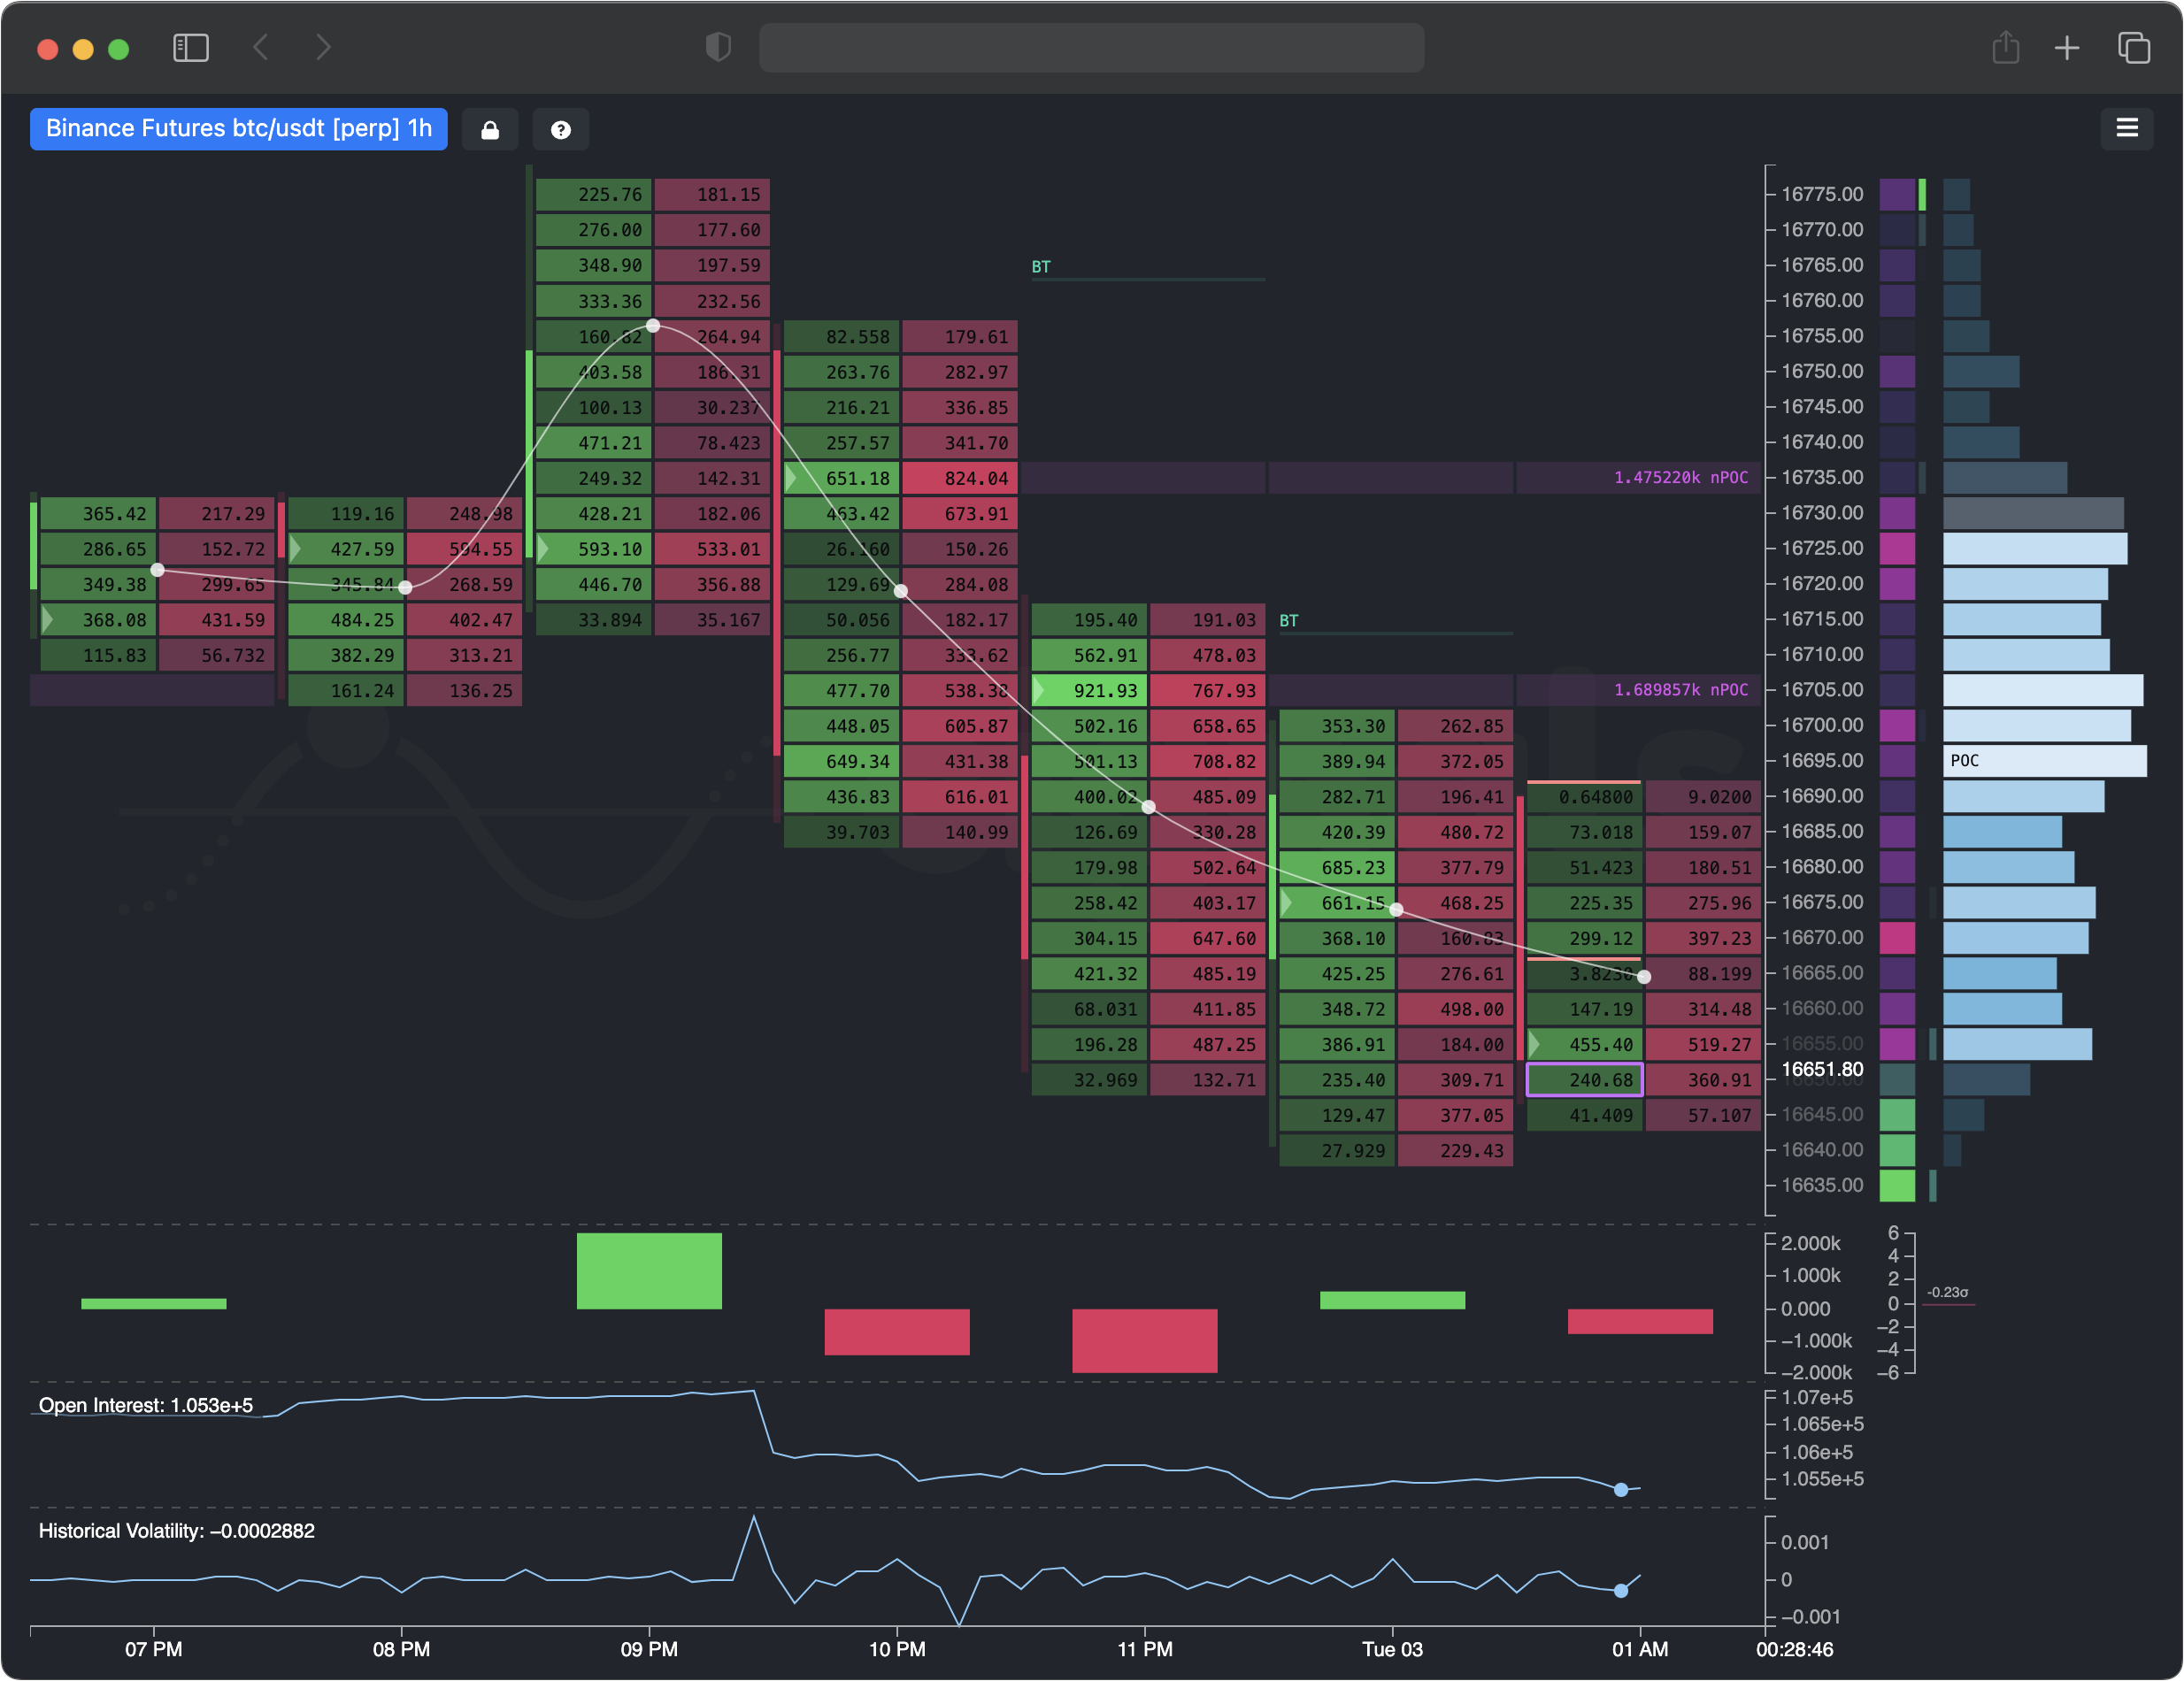
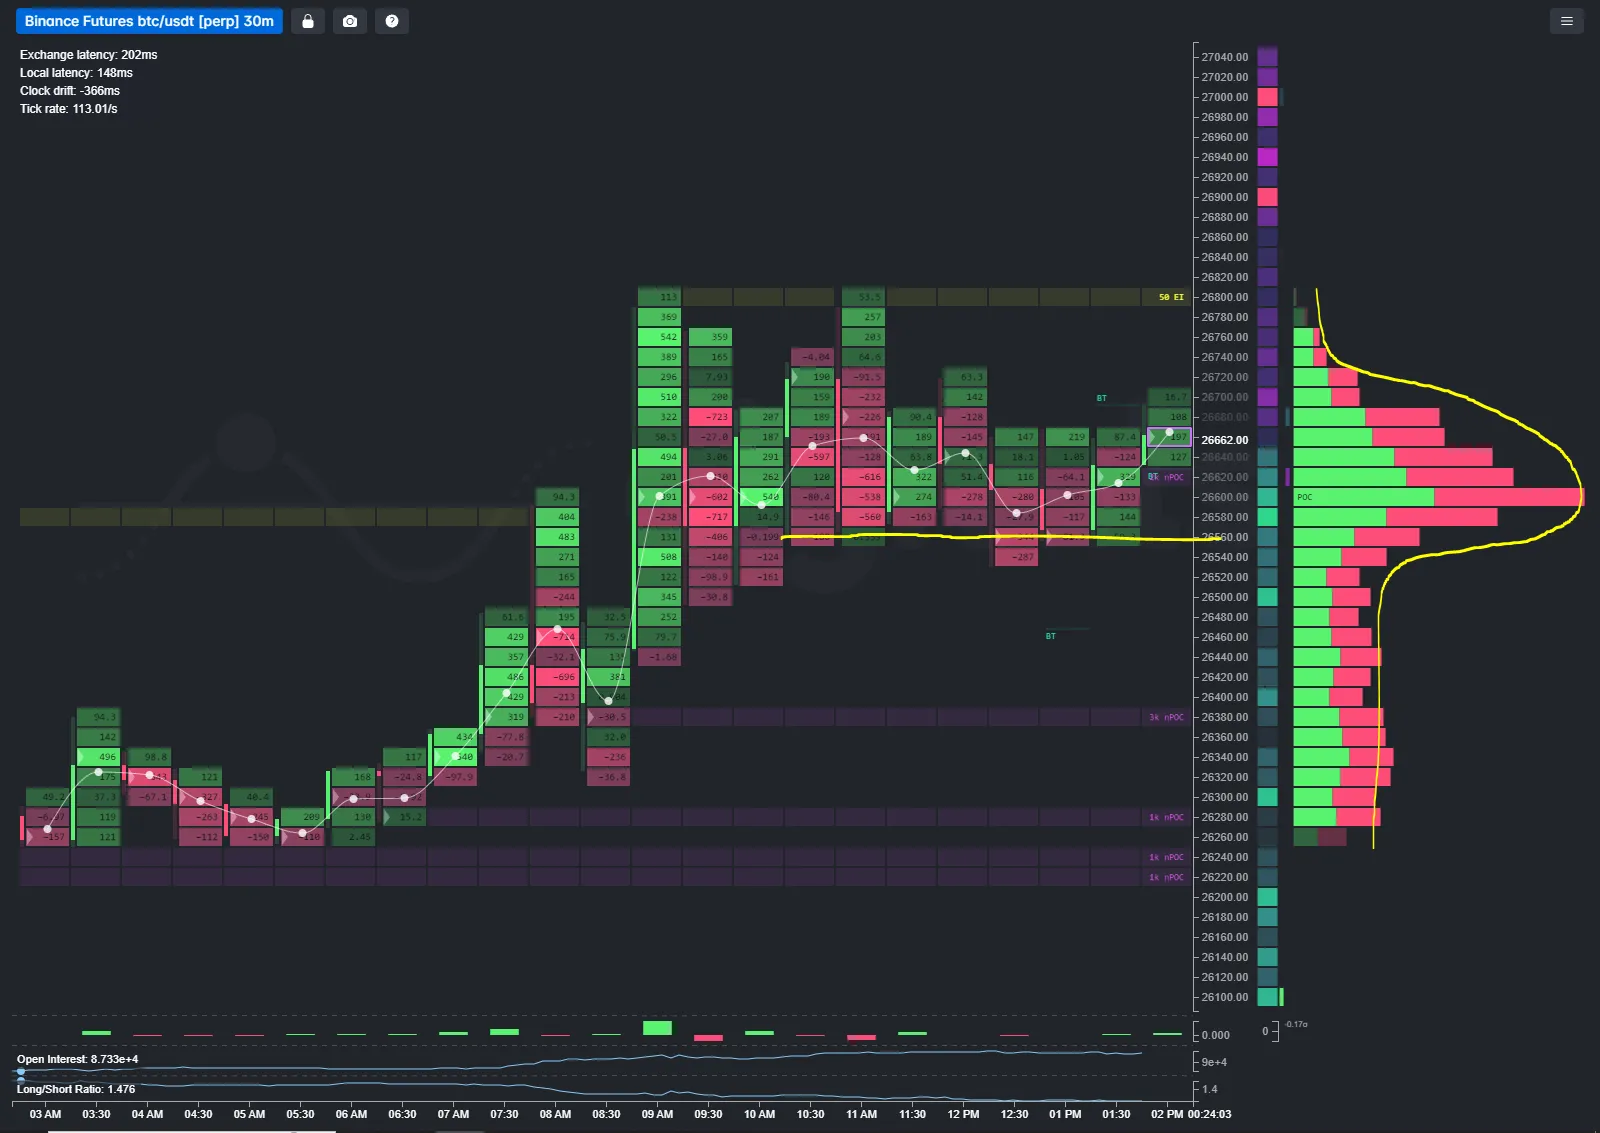
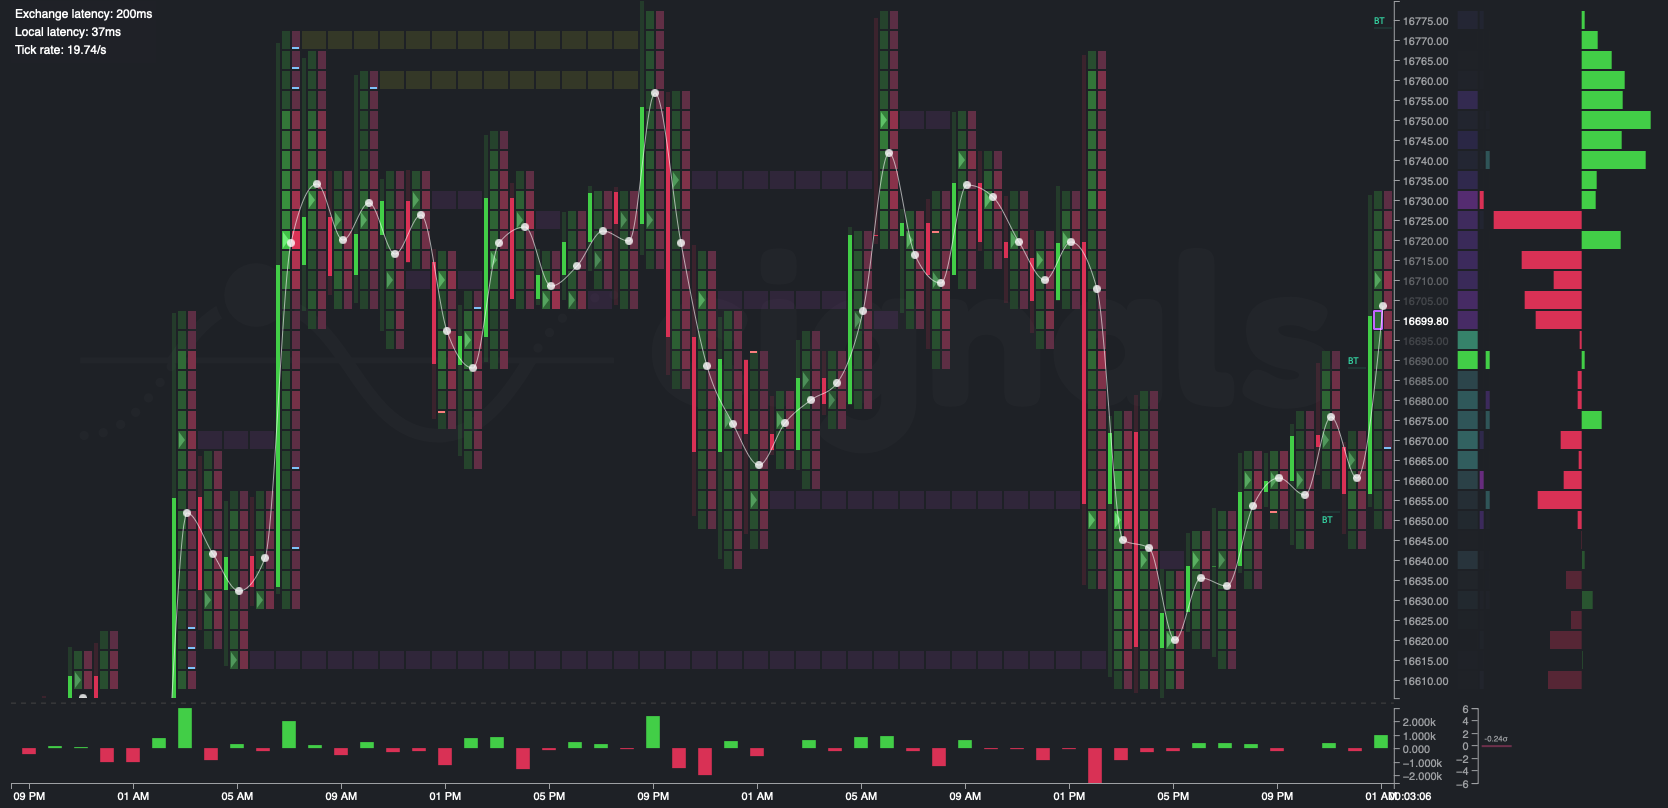
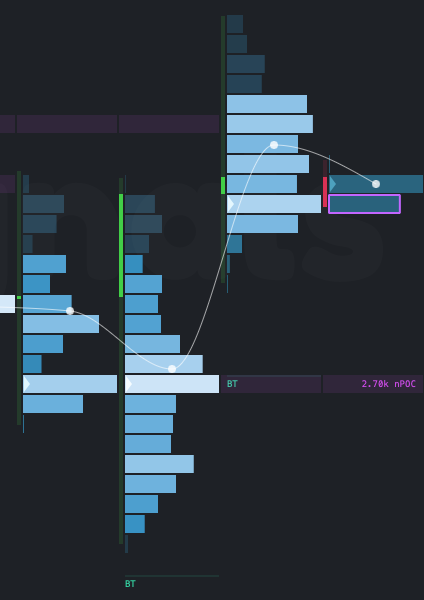
Cignals gives you a unique view of the action inside the candle. With this extra detail, you can see what market-makers are doing and trade with a superior edge, relative to other retail traders. Use three different views: delta of the trades, a buy/sell stacked split, or total volume for each price level. Deltas show you where absorption is high, stacks will give you the secrets behind imbalance, leading to additional trades to restore balance, and total volume indicates where the point of control is for each time step. Footprint charts are what professional traders use every day to make profitable trades.
Since 2016, our team of professional traders and engineers has been at the forefront of innovation in the crypto markets.
Edge Imbalance
Continuous Delta
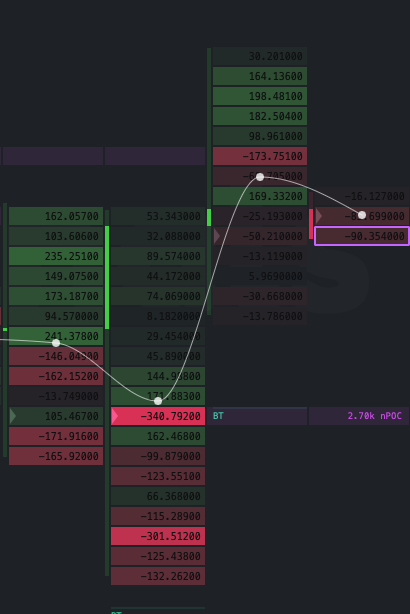
Delta Clusters
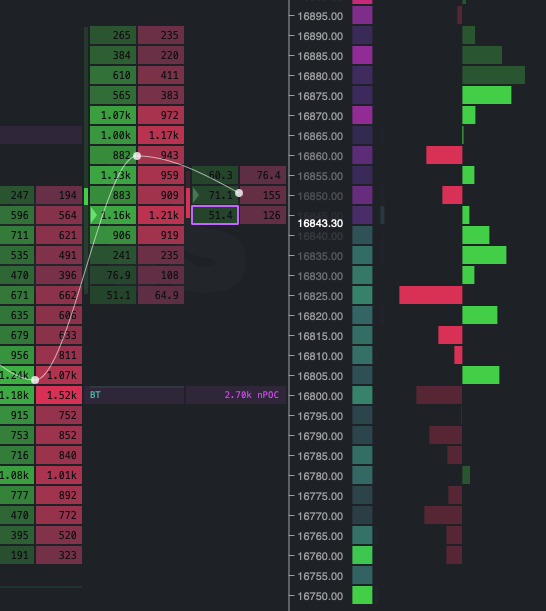
Volume Profile Clusters
Lower Studies
Overlays
Aggregate Delta
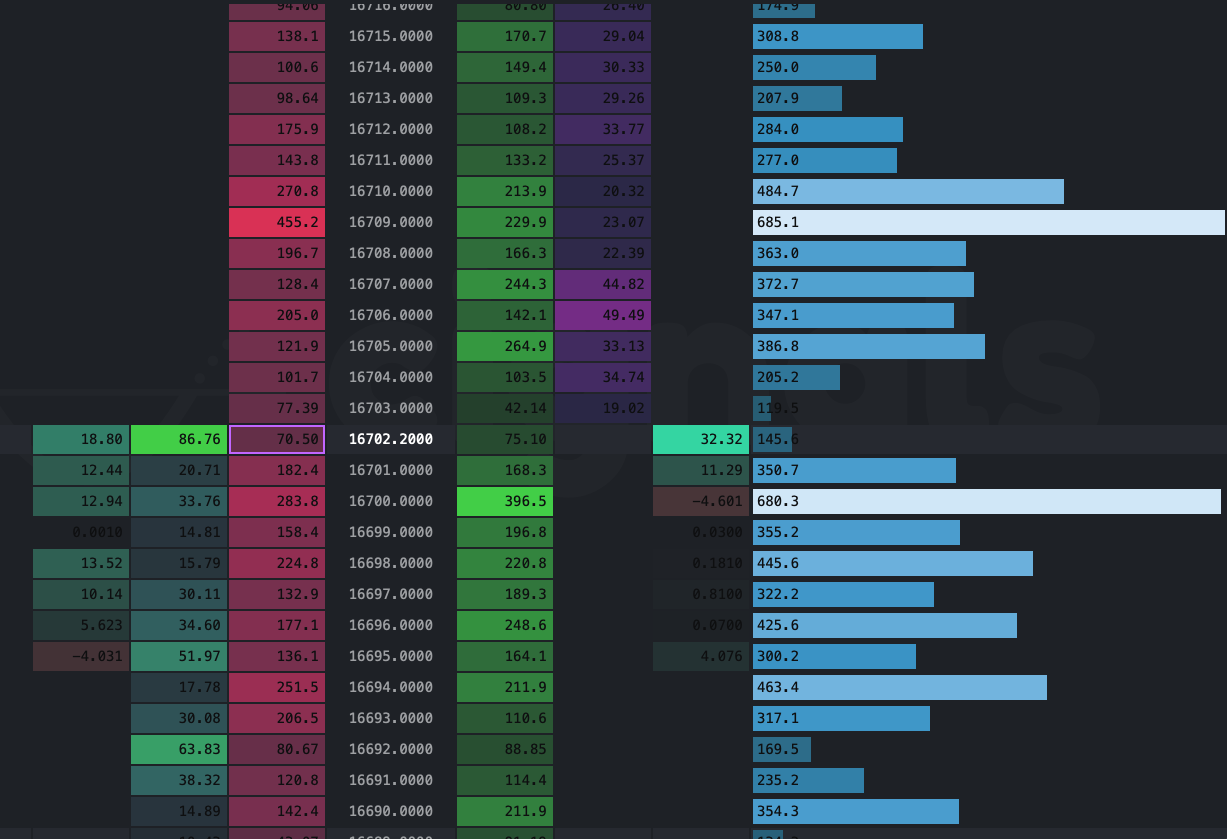
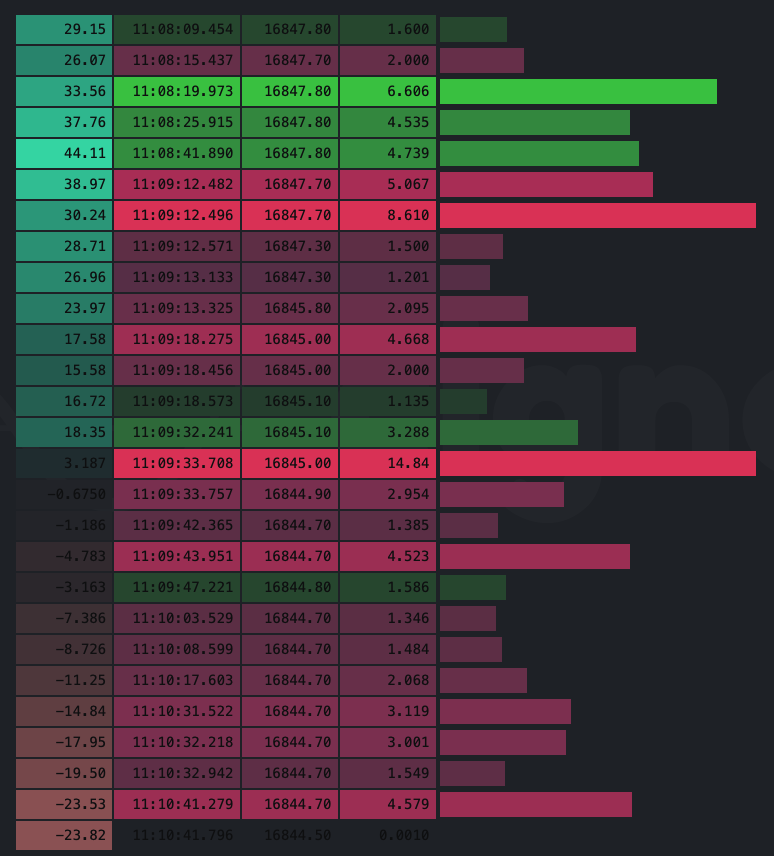
Advanced Tape & DOM
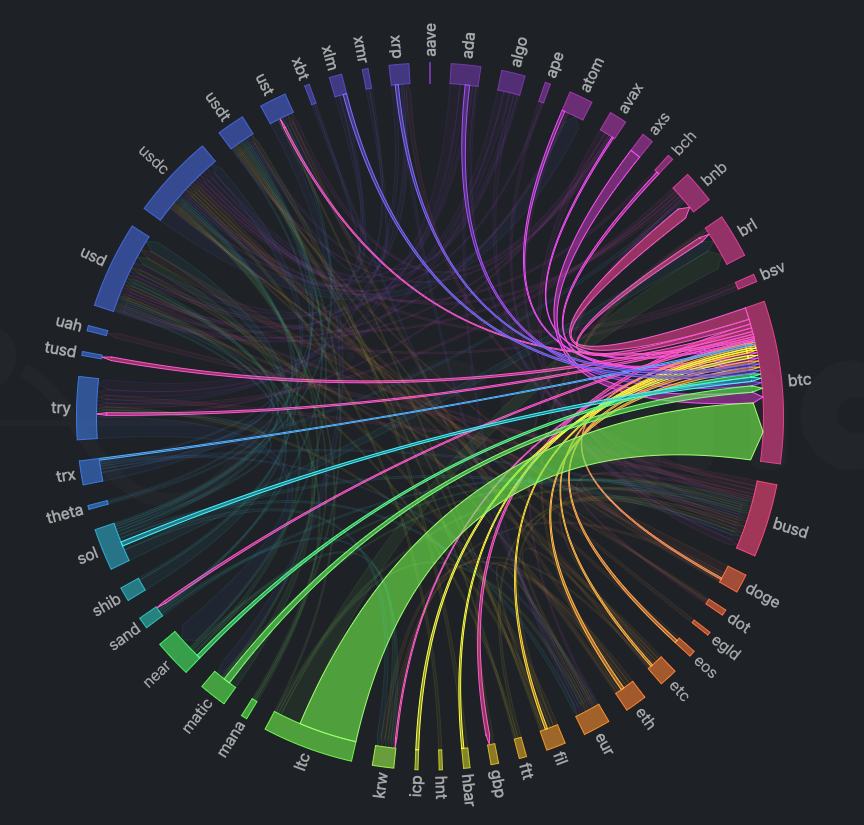
Our high-availability, professional-tier tick plant streams 4,119 instruments from 13 exchanges worldwide. This data is then aggregated and displayed directly on your screen so you can have the fastest access to the action. Data streams and historical data are available through our API and data warehouse for automated trading bots, quantitative trading strategies, or research.